We will analyze data such as sales volume, traffic development, and other very important statistics. This will help you improve your strategy, optimize your marketing campaigns, and achieve better results. But let's start at the beginning.
Black Friday is a commercial event characterized by discounts, offers, promotions, and sales of various goods and services. It is held both online (e-commerce) and in-store. The celebration originated in the United States, although in the last 5 years, it has spread to almost the entire world with impressive results that directly compete with other events.
From the consumer's point of view, it is a perfect event to buy interesting products at reduced prices, especially because of Christmas, which is celebrated a few weeks later.
Black Friday was first celebrated in the United States in the 1960s, and its creation is attributed to the Macy's store. The campaign aims to increase sales after Thanksgiving, which falls in November. Little by little, their success spread, and some companies and stores copied these storage strategies. It began to be called Black Friday in the 1980s. Its success has been enormous and the sale has caused long lines and chaos on the streets as consumers search for the best prices on their favorite products.
Black Friday is celebrated every year on the first Friday after Thanksgiving. In 2023, the date falls on November 24. Additionally, Cyber Monday will be celebrated on the Monday after Black Friday.
Initially, Black Friday lasted only one day. However, in recent years it has been decided to extend its duration. We can find e-commerce and brands offering offers and discounts from the day of the event until a week later (Cyber Monday).
Pre-Black Friday deals start appearing at the end of October and the beginning of November.
According to figures from Adobe Analytics, the 2022 edition of Black Friday surpassed 9 billion dollars in sales for the first time, with online sales of $9.12 billion. This number indicated an increase of 2.3% compared to 2021.
Black Friday in terms of consumer spending on mobile devices shows that it increased 81% on iOS and 61% on Android, compared to the average daily spending in November.
Remarketing was vital on the last Black Friday. Why? In-store shopping made a comeback on Black Friday, being more prominent among younger shoppers. More than 40% of Android remarketing strategies achieved user engagement globally.

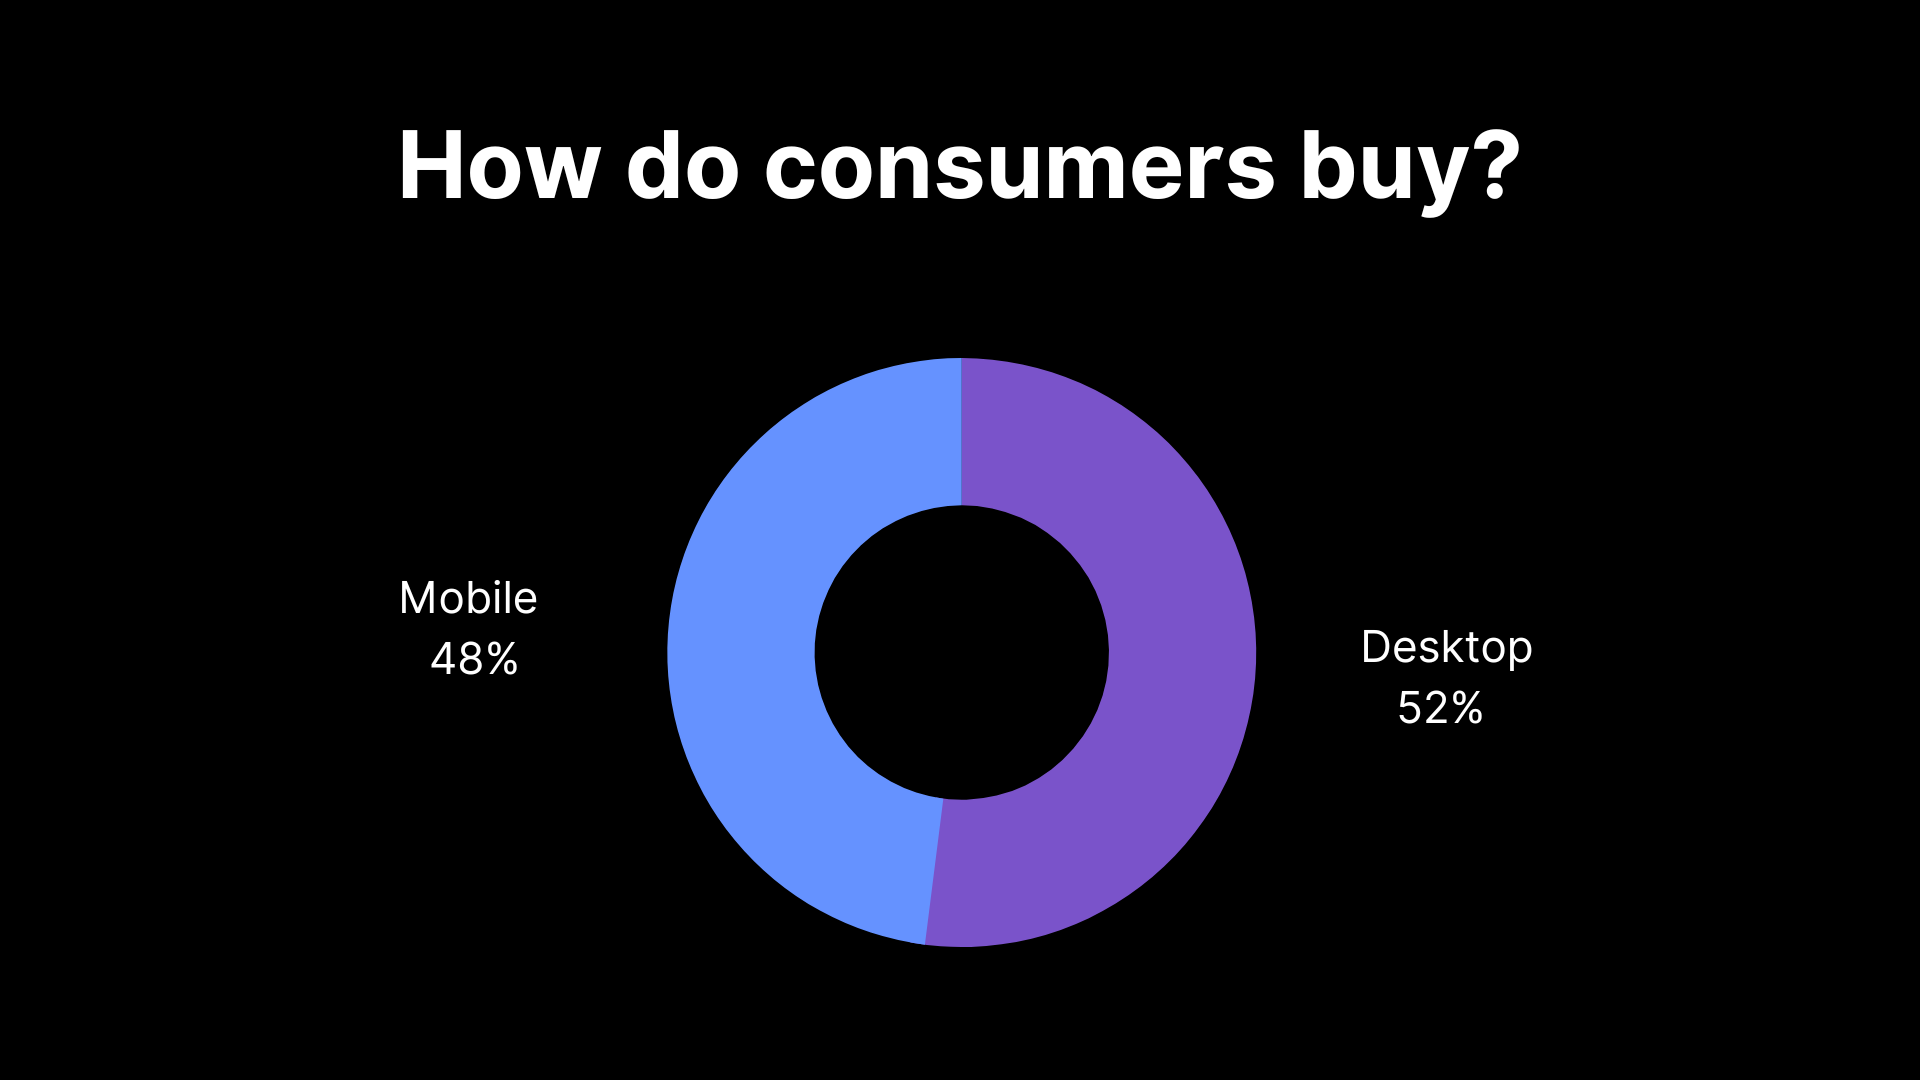
In 2022, consumers preferred to buy through their desktops, making 52% of total purchases worldwide. However, purchases through mobile devices increased by 4% in 2022 compared to 2021.
This result may be related to consumer buying habits. Mobile devices are used in many cases to browse and search for products. However, many users switch to a computer to complete their purchases.
The Add-to-Cart rate is a metric that measures the percentage of website users who add a product to their cart. This is very important information because it indicates a clear intent to buy and tells us how much of our total site traffic is actually interested in buying.
If we compare the Add-to-Cart rate that is registered throughout the year, during Black Friday we see a growth of almost 40%. The annual average is 10.9%. That of Black Friday of 14.58%. This means that there are many more buyers showing clear purchase intent.
As of Black Friday 2021, this rate was 76.63%, much less than the annual average of 81.01%. This figure is further proof that users who go to online stores during Black Friday have a much higher purchase intention, add more products to their carts, and abandon these carts less.
In addition, there was an average 10% increase in consumer spending in November 2022, compared to the same month in 2021, according to Appsflyer's latest report “The state of e-commerce app marketing”. Although consumers bought more goods or bought the same items that were more expensive due to inflation, it actually meant that it was consumers who absorbed the price increases.
A significant increase was seen not only globally but also in specific markets such as Brazil, Mexico, the UK, France, Germany, and the United Arab Emirates. With limited opportunities to save, consumers on both days spent more or the same amount as during last year's events.
Black Friday shoppers took advantage of sale prices in traditional gift categories. As in 2021, in 2022 clothing, shoes, and accessories led purchases with 53%, and then electronics just a step behind with 49%.
The third strongest category was toys with sales over 285% compared to 2021, with Fortnite, Roblox, Bluey, Funko Pop!, and Disney Charm in the lead. Last, were purchases of beauty products, personal care, and groceries.
Adobe research found that 48% of Black Friday e-commerce revenue came from mobile sales. This translates to about $3.7 billion, an increase of 2% over the prior year and a record for Black Friday.
The gap between in-store and online shoppers is highly generational, with younger generations using online shopping at a much higher rate than older ones. In fact, 86% of millennials/Gen Y/Gen Z say they'll do their Black Friday shopping online rather than in-store.
An estimated 141 million Americans plan to shop during Cyber Week. 75% of Gen Z planned to buy Black Friday deals, according to Finder's survey. 84% of Gen Z also found Black Friday sales a good value.
Women are more likely to shop online for Black Friday than men. The gap between in-store purchases and online purchases is not only generational but also by gender. In fact, 73% of female shoppers plan to do their Black Friday shopping online, compared to 65% of men.
In 2022, we've seen many significant retailers host several pre-Black Friday sales starting in October, and we expect this trend to continue strong.
Application use for mobile shopping continues to grow as shoppers seek convenience. Many apps allow consumers to purchase items with just a few clicks on their smartphones. These apps have been designed for the mobile user and offer an optimized shopping experience.
Merchants are working hard to improve online shopping experiences through mobile devices and are starting to see the results of their efforts.
According to Adobe Analytics, Thanksgiving and Cyber Week have set new records for mobile sales this year. During Thanksgiving, 55% of sales were through smartphones (compared to 51% in 2021), while during Cyber Week, 51% were through mobile devices (up from 46% in 2021).
Black Friday shopping benefits for those with retail memberships were a growing trend in 2021, they continued in 2022, and we expect to see even more in 2023.
An example is the exclusive shopping event for Prime members that offers special offers to members in 19 countries. It will be in October when Amazon gives rise to Prime Big Deal Days!
According to Adobe Analytics Insights, buy now, pay later orders were up 85%, and revenue was up 88% compared to the prior week.
This trend could continue throughout 2023 and into the Black Friday shopping season.
Black Friday is a pivotal focus to gauge how e-commerce is faring, and consumer confidence is the most significant shopping period of the year.

.png)