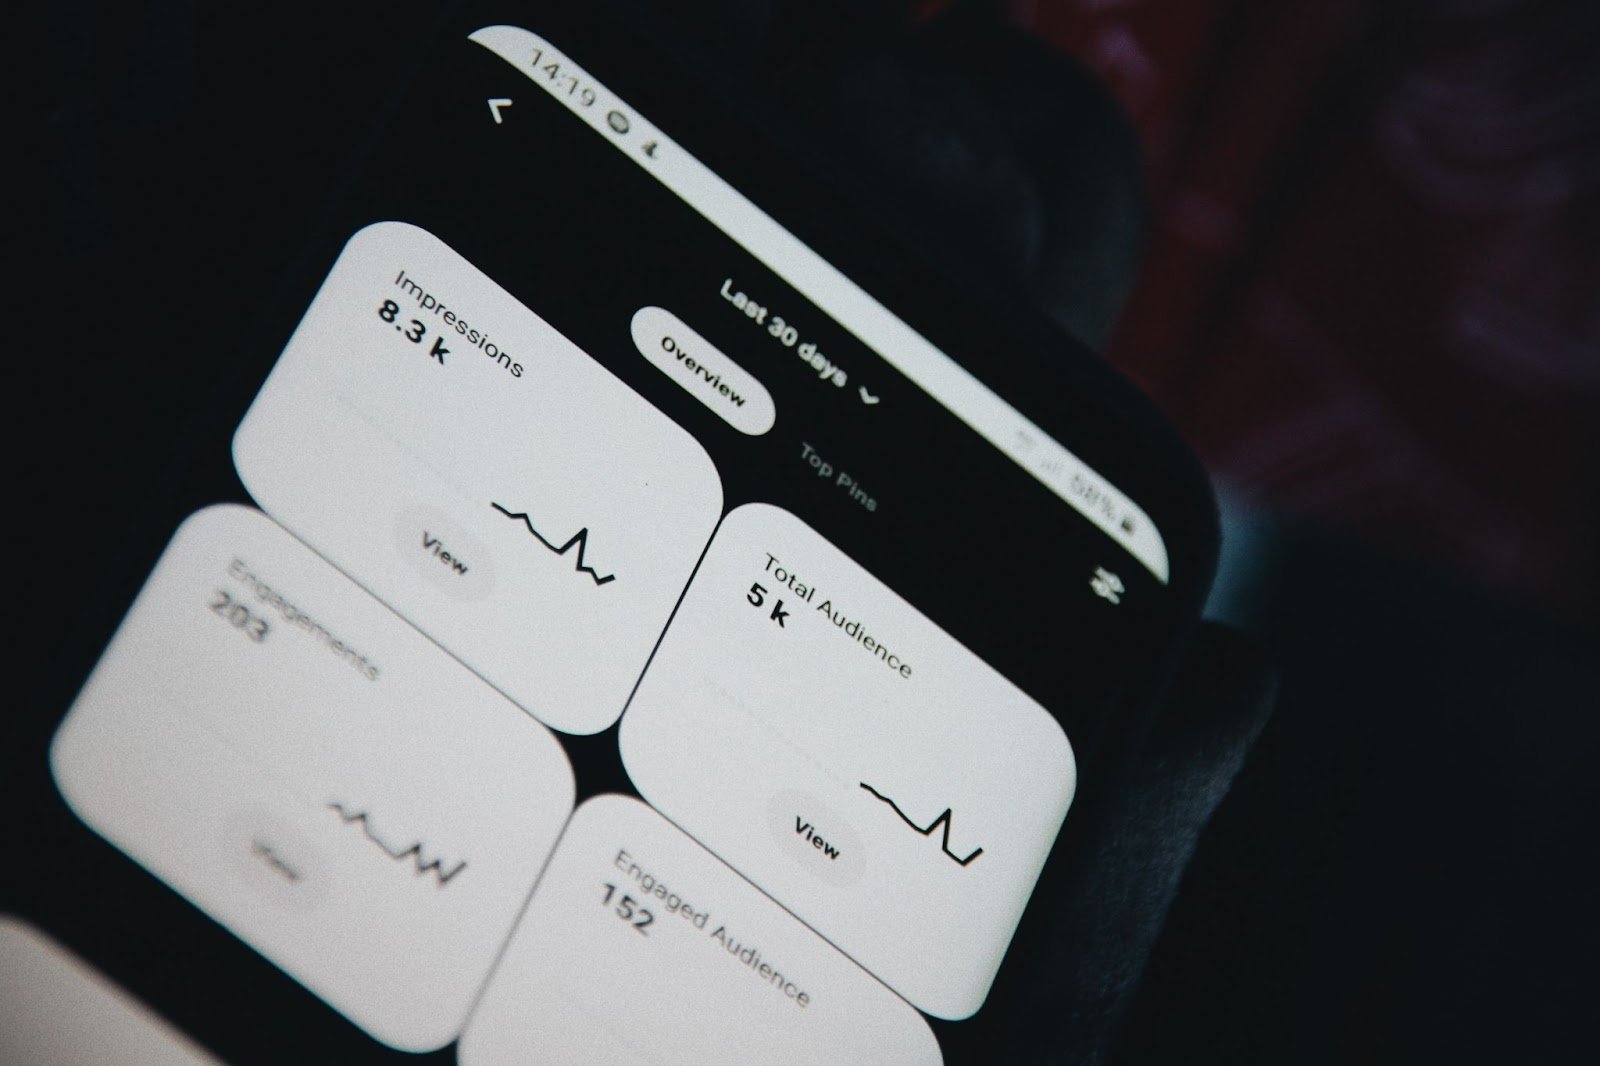
Without fully understanding and monitoring the performance metrics you will never know what might be going well or wrong on them, this also extends to user activity in your app. Having a good understanding of the metrics and what they can tell you is essential to tackle the problems, create new strategies, and make your app grow.

But the more the mobile industry evolves, the more metrics we have, and having so many metrics coming from different places and platforms can be a bit confusing and overwhelming. That’s why we decided to create this post explaining a few important KPIs and metrics for the industry that are commonly used and that are a must for you as an app marketer to know.
It is the rate at which the non-paid channels convert a user. There are several channels such as organic searches, word-of-mouth, social media mentions, etc… Measuring this KPI gives you an idea of what kind of results people who have a real interest in your app can generate since they did not receive any type of marketing activity to influence them to act. It’s important to have this metric as a benchmark.
Paid ones on the other hand are the opposite, is the rate you convert users from paid channels such as programmatic, ad networks, social media ads, etc… It is important to know the different Conversion Rates from the different paid channels of your campaigns, having a high conversion rate in a channel is a clear sign that the users are open to your app and that you are targeting accurately.
This one is quite self-explanatory. Users might like your app for a few days, weeks, months but after a while not that much, it is something completely normal for people to uninstall apps, but be aware that this metric is extremely important. Having a high uninstall rate might be a clear sign that something in your app is not working and you need to work fast to understand what it is and solve it, otherwise, you can lose a lot of users.
It is the percentage of users who stop using the app in a selected period. For example, if in February you had 300 users and at the end of the month you had 150, your churn rate is 50%. This one is also a very relevant metric to see how successful your app is over time.
It is the metric that measures how many users keep on using your app over some time, normally is measured in days. High retention means that the user is very interested in your app and what it provides since he keeps coming back. It is one of the most important metrics for generating revenue in an app since the more a user uses an app the more the app can monetize. Re-engagement campaigns, push notifications, new features, and other efforts are used to raise this metric.
Those are the most active users your app can have they use your app every day and every month. The DAU and MAU are great metrics of the success of your app, they are strictly related to growth and engagement.
This metric has been used more and more lately, it is the number of times a user opens your app. Social media apps and messaging have a high stickiness since there is a huge community using it and they interact with each other.
With this metric, you will be able to understand how much the users are spending on your app. Keeping an eye on this metric is great to see if there are any seasonalities tendencies or even if changes on the app impact the revenue generated.
The CLV is perhaps one of the most important metrics of your app, it represents how much a customer spends during his lifetime using the app. The Customer Lifetime Value is extremely related to the marketing efforts since sets the base of how much you can pay per user. Having the possibility to understand the CLV per media source is a great strategy to see where to invest.
Now that you know how to interpret some key metrics of your app and campaigns, let's work together and make your app grow! If you need any support or customize a strategy to increase any of the relevant metrics mentioned above, Rocket Lab is here for you!
